Apply Models: The Basics#
In this section, we provide a basic example of applying VAMPIRE models by
understanding information used to apply model
apply model using
vampire.model.apply_models
Directory structure#
After building the model, our working directory has the following files (suppose this is under the root directory of C:\ in Windows for convenience):
   |-- vampire-ogd
       |-- both
           |-- 4-50-4_40x_cortex_1_c1.tiff
           |-- ...
           |-- contour_coordinates__c1.pickle
           |-- vampire_datasheet__c1.csv
       |-- control
           |-- 4-50-4_40x_cortex_1_c1.tiff
           |-- ...
       |-- ogd-30min
           |-- 4-56-1_40x_cortex_1_c1.tiff
           |-- ...
       |-- (apply.xlsx)  # add this file
       |-- build.xlsx
       |-- control-ogd-30min.pickle
       |-- shape_mode_build_control-ogd-30min.png
We need to add an apply.xlsx file (shown in parentheses) that contains information about the image sets used to apply the model.
Image set information#
The apply.xlsx file contains information of the image sets used to
build VAMPIRE models. The spreadsheet contains 5 column:
img_set_path |
model_path |
output_path |
img_set_name |
channel |
|---|---|---|---|---|
|
|
|
control |
c1 |
|
|
|
ogd-30min |
c1 |
The first 4 columns are the required columns. These columns must present in the file to apply a model:
img_set_path- absolute path to the directory containing the image set used to apply modelmodel_path- absolute path to the.picklefile containing the model information to be appliedoutput_path- absolute path to the directory used to output figuresimg_set_name- name of the image set used to apply model
The columns beyond the first 4 columns (in this case, column 5), are optional columns. These columns are used to filter image filenames, where only images with the filter tag are used in building model. For example, we have
channel- the filtering type is image channelc1- only images containing the textc1are used in building the model.
Be sure to save and close the file to avoid potential permission error in future steps.
Applying models#
Now we can start to use the vampire package to build a VAMPIRE model. We first import necessary modules (don’t need to repeat if already imported).
>>> import pandas as pd  # used to read excel file
>>> import vampire as vp  # recommended import signature
We then read apply.excel as a pandas DataFrame.
>>> apply_df = pd.read_excel(r'C:\vampire-ogd\apply.xlsx')
>>> apply_df

img_set_path               model_path                                output_path      img_set_name   channel
C:\vampire-ogd\control     C:\vampire-ogd\control-ogd-30min.pickle   C:\vampire-ogd   control        c1
C:\vampire-ogd\ogd-30min   C:\vampire-ogd\control-ogd-30min.pickle   C:\vampire-ogd   ogd-30min      c1
To apply a VAMPIRE model, simply use the vampire.model.apply_models function and pass in the DataFrame.
>>> vp.model.transform_datasets(apply_df)
Depending on the amount of images used to build the model and amount of objects in the images, the function will run for a few seconds to a few minutes.
Resulting outputs#
Apply model outputs results into the output folder and stores contour coordinates and properties of objects in the image set folders.
Output folder#
The resulting outputs in the output folder C:\vampire-ogd are:
shape_mode_apply_control-ogd-30min_on_control.png
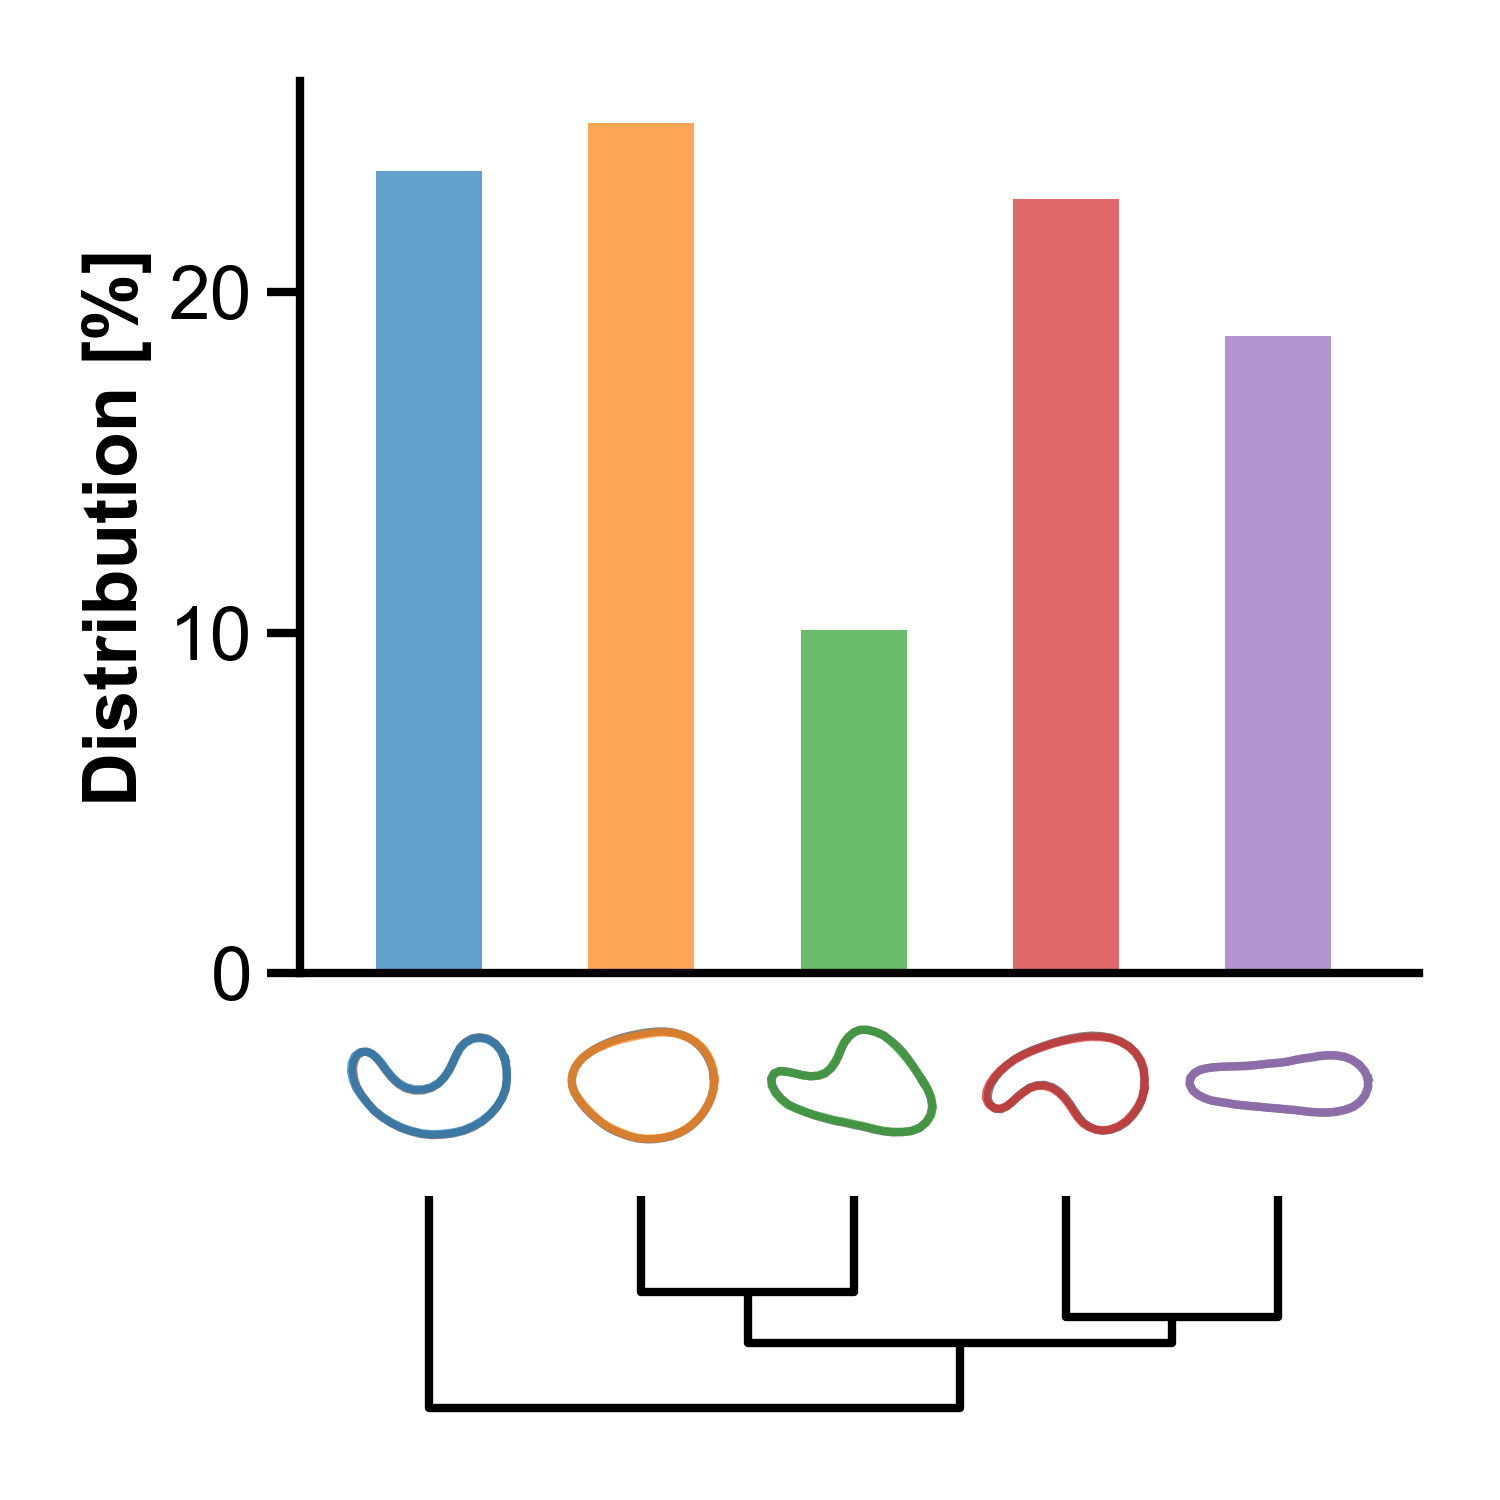
The figure contains shape mode visualization, dendrogram, and distribution. The colored contours are mean shape modes of the apply image set control, which is superimposed on the gray contours that are the mean shape modes of the build image set. The distribution shows the distribution of shape modes in the apply image set.
As shown in the figure, most shape modes (all except #3) in the control group are evenly distributed.
shape_mode_apply_control-ogd-30min_on_ogd-30min.png
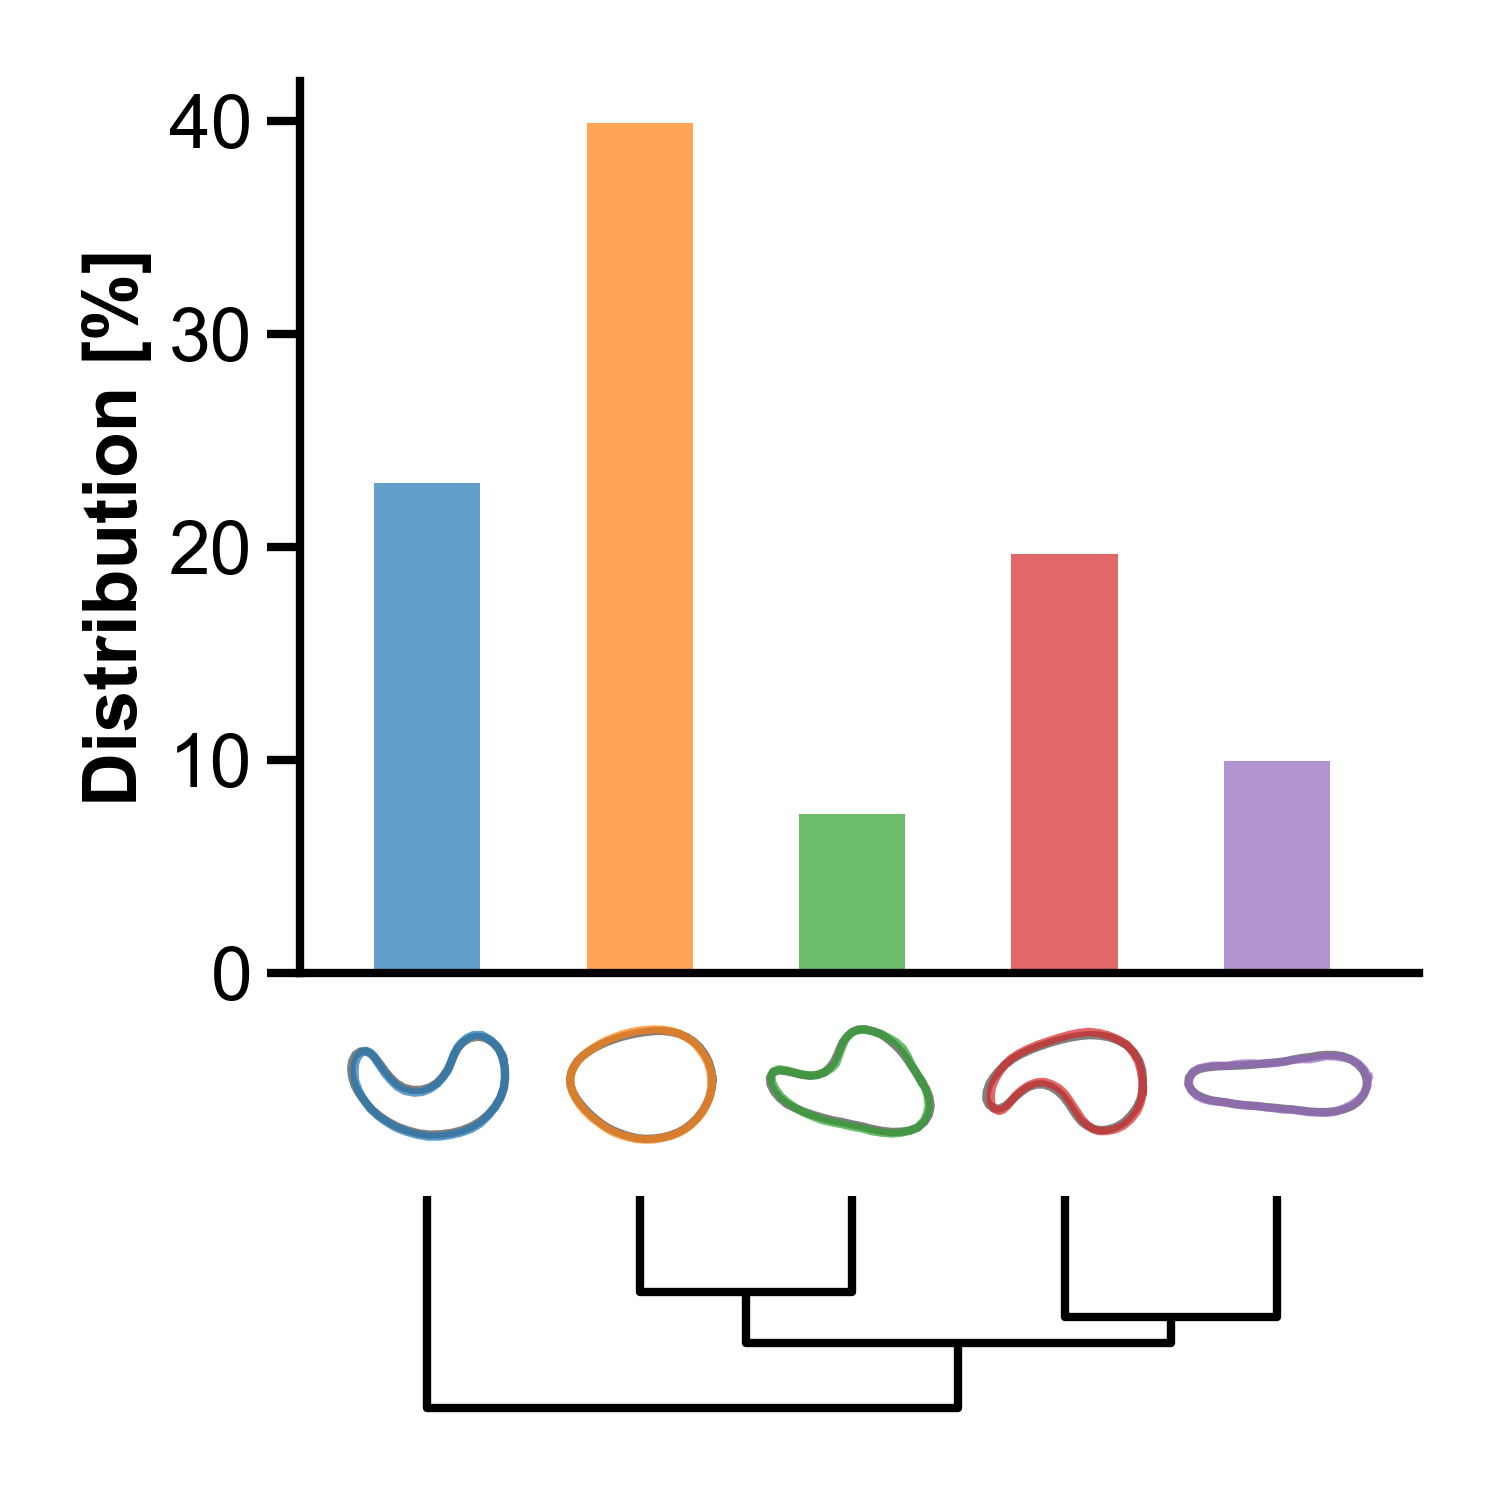
The figure has the same elements as above, but with the apply image set being ogd-30min. The round orange shape mode (#2) has much higher distribution than other shape modes within the group. The distribution of shape modes #3-5 has decreased within the group. Comparing across with the control group, the distribution of shape mode #2 has increased, that of #3-5 has decreased, and that of #1 has remained roughly the same.
Note
Please note the difference in y-axis limit. Such difference is due to the separate handling of plotting for each apply image set in the implementation.
Image set folders#
The resulting outputs in the image set folder C:\vampire-ogd\control are:
contour_coordinates__c1.picklevampire_datasheet__c1.csv
The resulting outputs in the image set folder C:\vampire-ogd\ogd-30min are:
contour_coordinates__c1.picklevampire_datasheet__c1.csv
which serve the same purpose as those in build model, but with different image sets.
Conclusion#
Congratulations! We have applied our first VAMPIRE model to two image sets. Next, we’ll look at some advanced options when specifying image set information for building models.